
BI reporting software: a practical guide for 2026
BI reporting software is defined as a category of tools that connect to data sources, process business data, and present it through interactive dashboards, charts, and scheduled reports. The industry term is business intelligence software, though “BI reporting” has become the common shorthand for the reporting and visualisation layer specifically. These platforms sit at the centre of how organisations turn raw numbers into decisions. Microsoft Power BI is used by 95% of the Fortune 500, which tells you how deeply embedded these tools have become across industries of every size. Whether you run a marketing team at a mid-sized company or oversee analytics for a large enterprise, choosing the right BI platform shapes how fast and how confidently your team can act on data.
What are the key features of BI reporting software?
The core job of any BI reporting platform is to pull data from multiple sources and present it in a format that non-technical readers can act on. Every platform worth evaluating does this differently, and the technical details matter more than most buyers realism at the start.

Data connectivity is the first thing to assess. Strong platforms connect to databases, cloud storage, spreadsheets, APIs, and SaaS tools without requiring custom code for every source. Power BI connects to over 100 data sources, including Microsoft Teams, SharePoint, Azure, and Excel. That breadth matters because your data rarely lives in one place.
Dashboard and report building tools vary widely in flexibility. Some platforms use drag-and-drop interfaces that let analysts build reports in minutes. Others require SQL knowledge or proprietary query languages to get beyond basic charts. The right choice depends on who builds the reports and how often they need to change.
Technical limits are where many teams get caught off guard. Key constraints to check before committing to a platform include:
- Dataset size caps. Power BI Pro limits datasets to 1 GB, which is a real ceiling for teams working with large transaction logs or event-level data.
- Data refresh frequency. Some tiers refresh data every 24 hours; others support near-real-time streaming. Know your latency tolerance before you sign a contract.
- Interactivity features. Filters, drill-downs, cross-report linking, and alert thresholds separate a useful dashboard from a static chart.
- Sharing and permissions. Row-level security and role-based access control determine whether you can safely share reports across departments or with external clients.
- Write-back capability. Most traditional BI platforms are read-only. If your team needs to enter data or trigger actions from within a report, you will need a separate application layer or a platform built as an application builder.
Pro Tip: Ask vendors specifically about dataset size limits and refresh frequency for the tier you plan to purchase, not the tier above it. Marketing materials almost always highlight the top tier.
How do open-source and proprietary BI platforms differ?
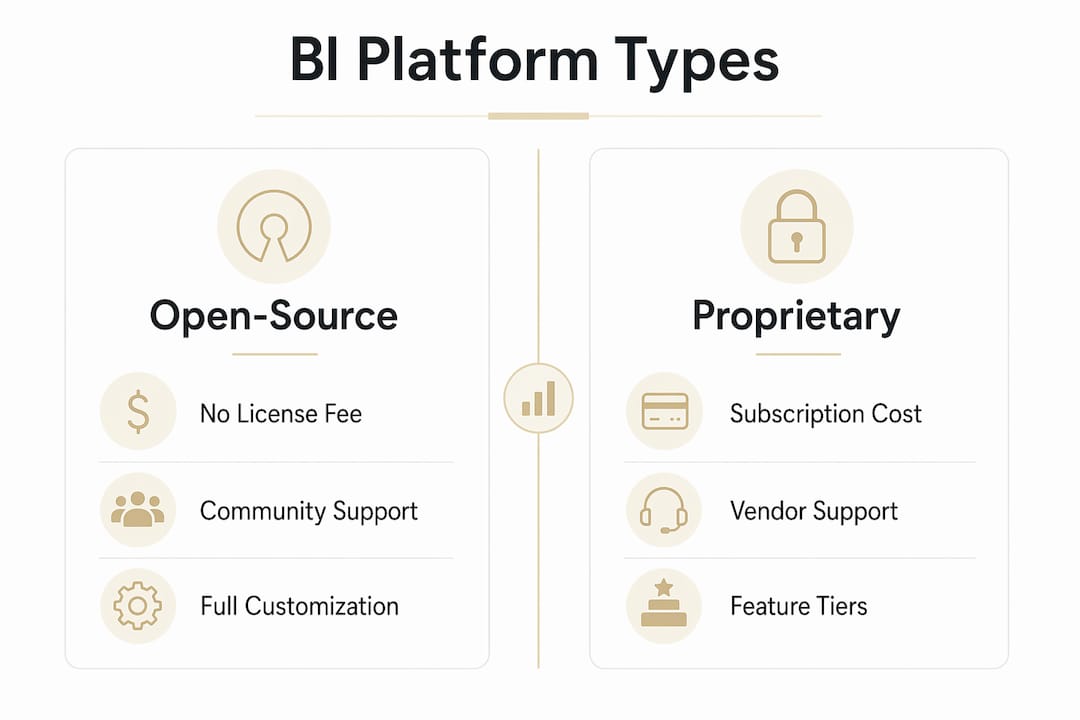
The open-source versus proprietary question is not simply about cost. It is about who owns the configuration, who maintains it, and what you can actually do with it.
Licensing and what it costs you
Licensing models shape both your budget and your feature access. Metabase uses an AGPL open-core model, which means enterprise features like SSO, auditing, and advanced permissions sit behind paid tiers. Apache Superset uses the fully open Apache 2.0 licence, so every feature is available without a commercial upgrade. That distinction matters if you plan to self-host and need enterprise-grade controls without a recurring licence fee.
Proprietary platforms like Power BI charge per user per month, with feature tiers that gate capabilities like paginated reports, AI-powered analysis, and larger dataset limits. The per-user model is predictable but adds up quickly as teams grow.
User personas and ease of setup
Metabase targets non-technical users with no-code querying, making it accessible to business analysts who do not write SQL. Apache Superset offers over 40 chart types and advanced SQL capabilities, which suits data engineering teams that need precise control over queries and visualisations.
Setup time reflects that difference. Metabase takes roughly 5–10 minutes to set up and requires 1–2 GB of RAM. Superset needs 15–30 minutes of configuration and 2–4 GB of RAM. Neither is difficult for a technical team, but Superset assumes you have one.
| Criteria | Open-source platforms | Proprietary platforms |
|---|---|---|
| Upfront cost | Low to none | Per-user licence fees |
| Customisability | High, with full code access | Limited to vendor-provided options |
| Setup complexity | Moderate to high | Low to moderate |
| Enterprise features | Varies by licence model | Included in higher tiers |
| Vendor support | Community-driven | Dedicated support contracts |
| Long-term maintenance | Internal team required | Managed by vendor |
Pro Tip: Open-source BI tools are not free if you factor in the engineering hours needed to maintain, upgrade, and secure a self-hosted instance. Calculate the total cost of ownership over 24 months before comparing sticker prices.
How to select the right BI reporting tool for your organisation
Selection frameworks work best when you start with people, not features. The tool that fits your organisation is the one your actual users will adopt and use consistently.
Define your user personas. Identify who builds reports and who reads them. Non-technical business users need no-code interfaces and guided querying. Data teams need SQL access, custom calculations, and rich chart libraries. A platform that serves one group well often frustrates the other.
Audit your data sources. List every system your reports will need to connect to: your CRM, marketing platforms, databases, spreadsheets, and cloud storage. Confirm that your shortlisted platforms support native connectors for each one, not just generic API access.
Set your dataset size requirements. Estimate the row counts and file sizes of your largest datasets today, then project 18 months forward. If you are near a platform’s cap now, you will exceed it before your contract renews.
Decide whether you need write-back or application features. The market splits between visualisation-only platforms and application builders that support forms, workflows, and data entry. If your team needs to act on data from within the tool, not just read it, a visualisation-only platform will leave you building workarounds.
Evaluate sharing and governance requirements. Consider whether reports will be shared internally only, with clients, or embedded in external products. Each scenario has different security, branding, and performance requirements.
Run a structured pilot. Give a small group of actual users two or three shortlisted platforms for two weeks. Measure adoption rate, questions raised, and time to first useful report. Real usage data beats any feature comparison matrix.
Pro Tip: The most common selection mistake is letting the IT team choose the tool without input from the analysts who will use it daily. Involve both groups from the first evaluation meeting.
The future of BI for small teams is moving toward lighter, more connected platforms that reduce the gap between technical and non-technical users. That trend should inform your selection today, not just your renewal decision in three years.
How does BI software integrate with modern business ecosystems?
Integration is where BI reporting platforms either accelerate your data culture or create friction that slows it down. The best platforms do not sit apart from your workflows. They embed into them.
Key integration capabilities to look for in 2026 include:
- Cloud and hybrid connectivity. Platforms that connect natively to cloud data warehouses like BigQuery, Snowflake, and Redshift give you access to large, centralised datasets without moving data manually.
- Embedded analytics. BI tools increasingly embed analytics directly into operational workflows, placing insights inside the tools your team already uses rather than requiring a separate login to a reporting portal.
- AI-powered analysis. Natural language querying, automated anomaly detection, and AI-generated summaries are moving from premium features to standard inclusions. These capabilities reduce the time between a question and an answer.
- Microsoft ecosystem integration. Power BI integrates tightly with Microsoft 365, including Teams and SharePoint, making it a natural entry point for organisations already invested in that ecosystem.
- Automated alerts. Threshold-based alerts that trigger when a metric crosses a defined value turn passive dashboards into active monitoring systems.
- Real-time data support. Streaming data connectors let teams monitor live metrics, which matters for marketing campaigns, e-commerce operations, and customer support queues.
The future of data visualisation points toward tighter integration between BI layers and the operational systems that generate data. Teams that build their BI stack with integration in mind now will spend less time rebuilding it later.
Key takeaways
The right BI reporting software is the one that matches your users’ technical level, connects to your actual data sources, and fits within your governance and budget requirements.
| Point | Details |
|---|---|
| Start with user personas | Match the platform’s interface complexity to the technical level of the people who will use it daily. |
| Check dataset limits early | Platforms like Power BI Pro cap datasets at 1 GB; verify limits against your current and projected data volumes. |
| Understand licensing fully | Open-source tools under AGPL may gate enterprise features; Apache 2.0 tools offer full access without paid upgrades. |
| Assess write-back needs | Most BI platforms are read-only; teams needing data entry or workflow actions require an application builder layer. |
| Run a real pilot | Two weeks of actual usage by real users reveals adoption barriers that no feature list will show you. |
What I have learned from watching teams choose BI tools
The pattern I see most often is this: a team selects a BI platform based on a demo, signs a contract, and then discovers six months later that the tool does not fit how their analysts actually work. The demo showed the best-case scenario. The daily reality showed the gaps.
The uncomfortable truth about BI tool selection is that the technical evaluation is the easy part. The hard part is getting honest answers from your own team about how they currently work, what they actually need, and what they will realistically adopt. A platform with 40 chart types is worthless if your analysts default to exporting data to a spreadsheet because the interface feels unfamiliar.
I have also seen teams underestimate the cost of open-source platforms. The licence is free. The engineering time to install, configure, secure, and upgrade it is not. For teams without a dedicated data engineer, a managed proprietary platform often costs less in total than a self-hosted open-source alternative.
The trend toward AI-driven analysis and natural language querying is real and accelerating. But I would not let AI features drive your selection decision in 2026. Choose the platform your team will actually use today. Evaluate AI capabilities at renewal.
Treat your first BI platform selection as a starting point, not a permanent commitment. Evaluate it against your actual usage data after 12 months and adjust accordingly.
How Metrbox supports your BI reporting and measurement strategy
Building a reliable BI reporting system requires more than choosing the right platform. It requires clean data, consistent tracking, and a measurement framework that connects your reports to real business outcomes.
Metrbox helps marketing teams, founders, and agencies build exactly that. From marketing ROI measurement to full analytics implementation, Metrbox provides the frameworks, dashboards, and tracking systems that make your BI investment pay off. If your reports are built on unreliable data, the platform you choose does not matter. Metrbox fixes the foundation first. Explore the full range of analytics and measurement solutions to see how your team can report with confidence.
FAQ
What is BI reporting software?
BI reporting software connects to business data sources and presents the data through interactive dashboards, charts, and scheduled reports. The goal is to help teams make faster, more informed decisions without requiring manual data processing.
What is the difference between open-source and proprietary BI tools?
Open-source platforms like Apache Superset offer full feature access under permissive licences, while open-core tools like Metabase gate enterprise features behind paid tiers. Proprietary platforms charge per-user fees but include vendor support and managed infrastructure.
Can BI reporting tools handle real-time data?
Some platforms support streaming data connectors and near-real-time refresh schedules, while others refresh on a fixed daily cycle. Confirm the refresh frequency for your specific pricing tier before purchasing.
What is a common technical limitation in BI platforms?
Dataset size caps are one of the most frequently overlooked limits. Power BI Pro, for example, caps datasets at 1 GB, which can restrict teams working with large event-level or transactional datasets.
Do BI tools support data entry and workflow actions?
Most traditional BI platforms are read-only and do not support write-back or data entry natively. Teams that need to act on data from within a report require either a separate application layer or a platform built as an application builder.

GA4 Audience Export to BigQuery: Step-by-Step Guide for Small Teams
For small teams and startup founders aiming to elevate marketing and analytics capabilities, exporti
Measure to Maximize: Your Roadmap to Google Analytics 4
Let's be real. We're in the business of proving ROI. That means proving our ROI, too. And if you're

Top 3 Supermetrics Alternatives 2026
Explore these 3 supermetrics alternatives to help you choose the best data integration solution for