The Future of Data Visualization in Business
As we navigate the increasingly complex digital age landscape, data visualization’s importance in business cannot be over-emphasized. In my experience, the ability to transform raw data into visually compelling stories is not just a valuable skill—it is a necessity for making informed decisions that drive success.
The future of data visualization holds the promise of even more sophisticated tools and techniques, enabling businesses to glean deeper insights and create more impactful strategies. With advancements in artificial intelligence, machine learning, and interactive technologies, we are on the cusp of a new era in which data visualization will be more accessible and intuitive.
In this post, we will try to explore the emerging trends and innovations set to revolutionize how we interpret and utilize data in the business world. From integrating real-time analytics to immersive technologies like augmented reality, these developments have tendencies to transform the data visualization landscape, making it an indispensable asset for businesses aiming to stay ahead in a competitive market!
Emerging Data Visualization Trends in Business
In my experience, one of the most significant data visualization trends reshaping the business landscape is the integration of AI-driven insights. The potential of artificial intelligence and machine learning algorithms to revolutionize how we analyze and present data is immense, making it possible to rapidly glean actionable insights from complex datasets.
For instance, Gartner reported that by 2025, AI will be embedded in 90% of new enterprise applications, underscoring the importance of AI in future business intelligence strategies. Businesses that harness these capabilities can create dynamic, real-time visualizations that present data and predict future trends, facilitating more informed and proactive decision-making. It’s important to note that AI-driven data visualization also enhances storytelling with data, allowing us to craft narratives that are compelling and grounded in predictive analytics.
Moreover, storytelling with data has become an indispensable tool for effective communication in the business world. When I worked with a healthcare company, we utilized narrative-driven dashboards to convey complex patient data trends to non-technical stakeholders.
This approach significantly improved stakeholder engagement and decision-making efficiency. Businesses can bridge the gap between data scientists and decision-makers by transforming raw data into coherent, visually engaging stories. Looking ahead, the future of business intelligence lies in our ability to leverage these emerging trends to create a data-driven culture where insights are seamlessly integrated into everyday business processes.
Enhancing Data-Driven Decision-Making
Moreover, storytelling with data has become an indispensable tool in enhancing data-driven decision-making. We can bridge the gap between complex analytics and actionable business insights by transforming raw data into visually engaging narratives.
McKinsey & Company highlights that organizations employing compelling data storytelling can increase decision-making efficiency by over 40%. In practice, companies have used interactive dashboards and customized visual reports to communicate insights more effectively and foster a culture of data literacy across all organizational levels.
This approach ensures that even non-technical stakeholders can grasp critical insights, leading to more cohesive and informed business strategies. As we look to the future of business intelligence, it’s clear that crafting compelling data stories will play a pivotal role in driving strategic initiatives and achieving competitive advantage.
Leveraging AI-Driven Insights Effectively
Leveraging AI-driven insights requires not only the adoption of advanced analytics tools but also a strategic framework to integrate these insights into decision-making processes. It’s important to note that AI can uncover patterns and trends within vast datasets that might be invisible to the human eye.
According to a report by Gartner, businesses that successfully implement AI-driven analytics can outperform their peers by up to 25% in profitability. In my experience, organizations that embed AI insights into their operations—whether through real-time analytics platforms or predictive models—tend to make more informed and timely decisions.
For instance, a retail company utilizing AI to analyze customer behaviour data can adjust its inventory and marketing strategies proactively, thus optimizing both customer satisfaction and revenue streams. Similarly, in the healthcare industry, AI can be used to predict patient outcomes and optimize treatment plans, leading to improved patient care and reduced costs.
To effectively harness AI-driven insights, businesses must also invest in upskilling their workforce and fostering a data-centric culture. Training programs that enhance employees’ data literacy and analytical skills are crucial for maximizing the utility of AI tools. IBM’s Global AI Adoption Index indicates that companies prioritizing employee training in AI and analytics are more likely to see significant returns on their technology investments.
I’ve observed tech firms integrating AI insights into their product development cycles, enabling faster iteration and innovation driven by tangible data rather than intuition alone. By aligning AI capabilities with strategic business goals, companies can react to market changes swiftly and anticipate future trends, thereby securing a sustainable competitive edge in the evolving landscape of business intelligence.
This stress on the importance of continuous learning and development can inspire a sense of growth and progress in your audience.
Storytelling with Data: Best Practices
One of the most compelling emerging trends in data visualization is the art of storytelling with data. It’s not just about presenting numbers; it’s about weaving those numbers into a narrative that drives action.
The ability to tell a coherent, impactful story with data can be a game-changer for businesses. For instance, companies like Airbnb have successfully used data storytelling to communicate complex information in a way that is both understandable and compelling to stakeholders.
According to a study by the Data Visualization Society, businesses that adopt storytelling techniques in their data presentations see a 70% improvement in stakeholder understanding and engagement. This emphasis on storytelling in data visualization can inspire a sense of creativity and innovation in your audience.
Additionally, the future of business intelligence lies in enhancing these storytelling capabilities through advanced visualization tools. By utilizing interactive dashboards and dynamic visualizations, executives can gain real-time insights and quickly adapt their strategies. This approach is particularly beneficial in sectors such as healthcare, where data-driven decision-making can lead to significant improvements in patient outcomes.
By integrating storytelling into data visualization practices, organizations can demystify complex datasets and drive more effective and timely decision-making processes.
Future Directions in Business Intelligence
With this ever-changing market conditions, It’s important to note that AI-driven insights are revolutionizing how we interpret data. By leveraging machine learning algorithms, businesses can uncover patterns and trends that could be missed, enabling more informed, data-driven decision-making. For example, retail giants like Amazon have effectively utilized AI to predict consumer behaviour, optimize pricing strategies, and manage inventory levels, leading to significant gains in efficiency and profitability.
According to Gartner, by 2025, over 75% of enterprises will rely on AI to operationalize their data strategies, underscoring the critical role of AI in the future of business intelligence.
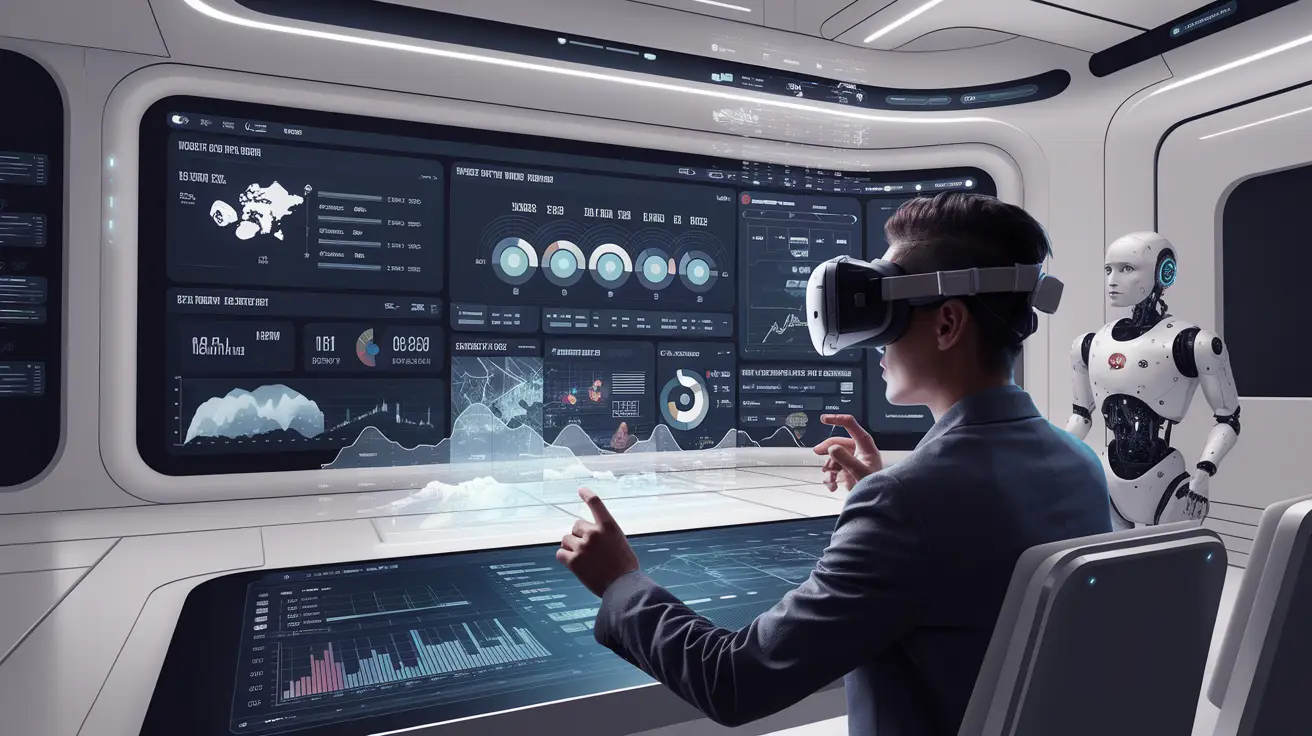
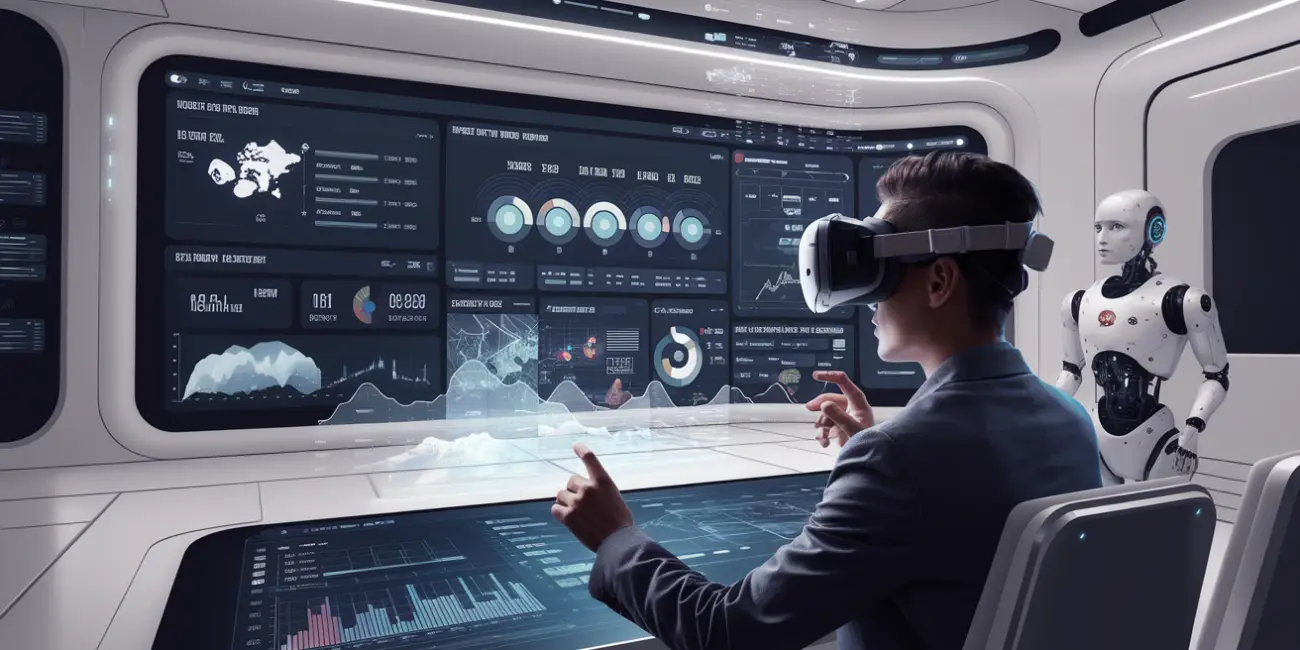
Another key trend is the integration of augmented and virtual reality into data visualization. These technologies offer immersive experiences that can make complex datasets more accessible and easier to understand. Imagine a financial analyst using augmented reality to visualize stock market trends in a 3D space, gaining insights that could be missed in traditional 2D graphs. Early adopters in sectors like healthcare and finance have already seen the benefits of AR and VR in data visualization, from improving diagnostic accuracy to enhancing portfolio management strategies.
As these technologies become more mainstream, I foresee a future where data visualization is not just a tool for analysis but an interactive experience that drives strategic decision-making in real time.
From what I’ve experienced, the future of data visualization in business is not just a passing trend but a core component of strategic decision-making. Adopting innovative visualization techniques becomes imperative as companies increasingly rely on data to drive their operations. According to a Gartner report, over 80% of data scientists will be using AI-based augmented analytics by 2025, highlighting the growing significance of advanced tools in transforming raw data into actionable insights.
Consider, for example, the successful implementation of real-time dashboards in retail giants like Walmart. By leveraging predictive analytics and dynamic data visualization, Walmart has optimized inventory management and enhanced customer experiences.
Looking forward, I foresee continued AI and machine learning integration in data visualization tools, enabling more intuitive and interactive user experiences. Businesses that stay ahead of these advancements will not only improve their decision-making processes but also foster an adaptable and forward-thinking data-driven culture.
In conclusion, the evolving landscape of data visualization offers immense potential for businesses willing to embrace it. With the right strategies and tools, organizations can transform data into their most valuable asset, driving innovation and growth in an increasingly competitive market.
How to Set Up GA4 for Your Startup
Look, I’ve been there. You’re juggling a million things to get your startup off the grou
How to Track Key Metrics with Google Tag Manager
Stop Guessing, Start Growing: How to Track Key Metrics with Google Tag Manager (Even if You’re
Data-Driven Decision Making: How to Turn Insights into Action
Most businesses are swimming in data but remain stuck in analysis paralysis. What separates successf
